After few months of Scalar being present in the Google Play Store, we decided to check what is the distribution of digits (buttons) used by our users directly in the application. Below we present gathered data that say something, but we do not know exactly what. Maybe you will help in the interpretation? Do you see any relation to the Benford’s law?
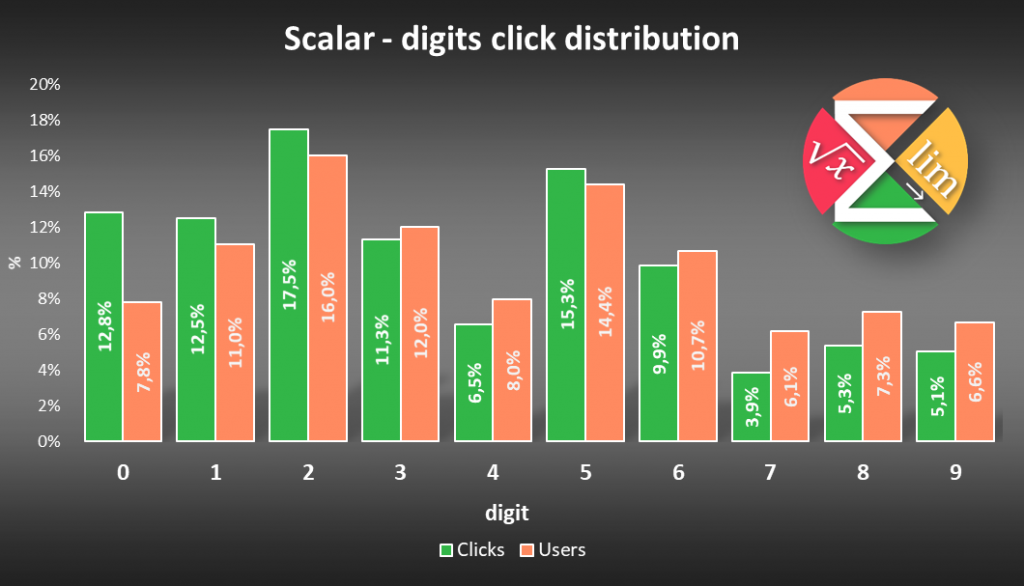
⭐ Scalar – digits clicks distribution – ordered by digit
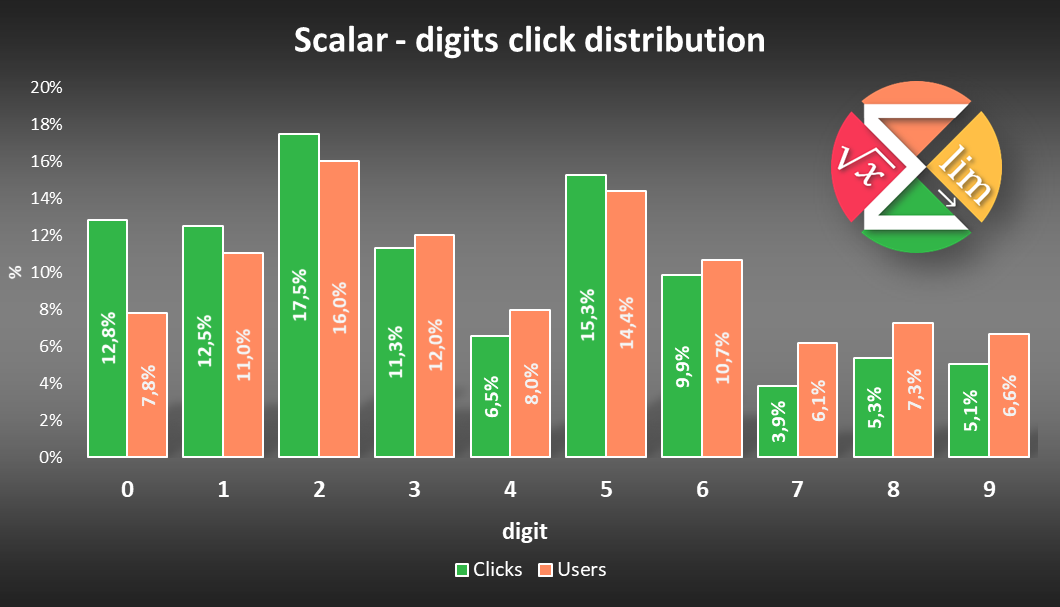
The most frequently used numbers are 2 and 5. It is also well visible the effect of multi-use of the digit 0 considering particular user perspective. The digit, that is used the least often, is 7.

| Digit | Clicks [%] | Users [%] |
| 0 | 12.8% | 7.8% |
| 1 | 12.5% | 11.0% |
| 2 | 17.5% | 16.0% |
| 3 | 11.3% | 12.0% |
| 4 | 6.5% | 8.0% |
| 5 | 15.3% | 14.4% |
| 6 | 9.9% | 10.7% |
| 7 | 3.9% | 6.1% |
| 8 | 5.3% | 7.3% |
| 9 | 5.1% | 6.6% |
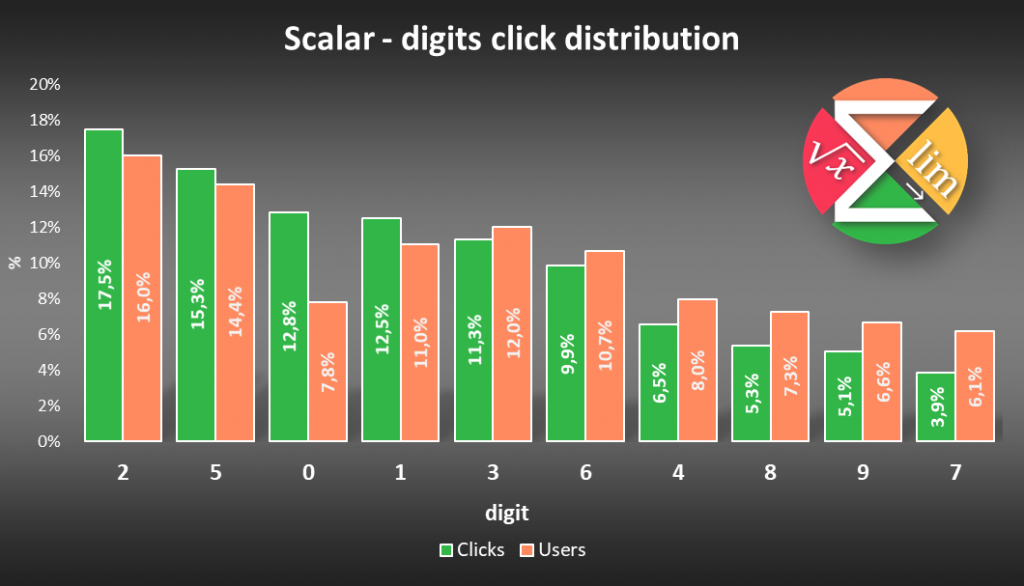
Scalar – digits clicks distribution – ordered by clicks
Sequence: 2, 5, 0, 1, 3, 6, 4, 8, 9, 7

| Digit | Clicks [%] | Users [%] |
| 2 | 17.5% | 16.0% |
| 5 | 15.3% | 14.4% |
| 0 | 12.8% | 7.8% |
| 1 | 12.5% | 11.0% |
| 3 | 11.3% | 12.0% |
| 6 | 9.9% | 10.7% |
| 4 | 6.5% | 8.0% |
| 8 | 5.3% | 7.3% |
| 9 | 5.1% | 6.6% |
| 7 | 3.9% | 6.1% |
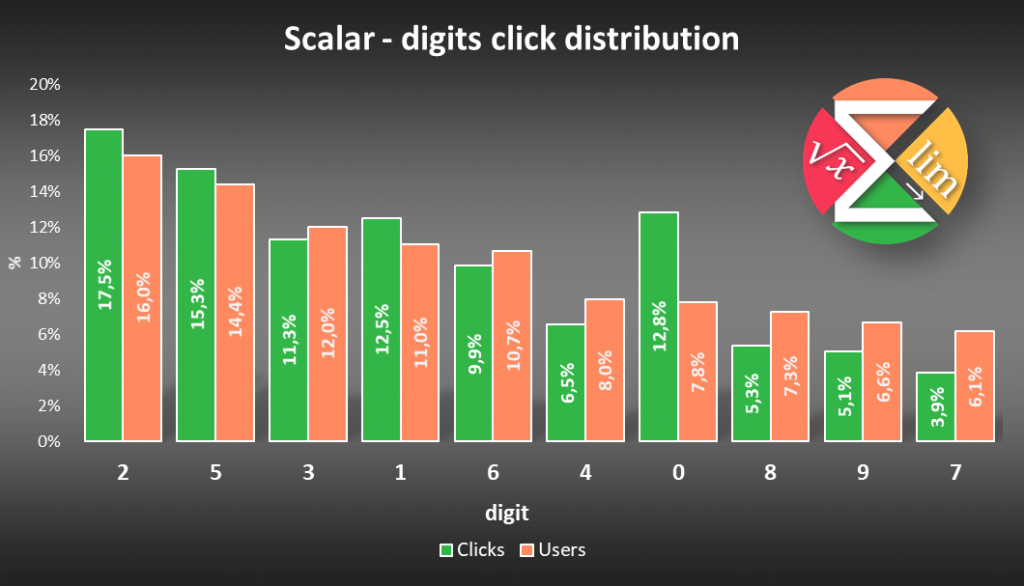
⭐ Scalar – digits clicks distribution – ordered by users
Sequence: 2, 5, 3, 1, 6, 4, 0, 8, 9, 7

| Digit | Clicks [%] | Users [%] |
| 2 | 17.5% | 16.0% |
| 5 | 15.3% | 14.4% |
| 3 | 11.3% | 12.0% |
| 1 | 12.5% | 11.0% |
| 6 | 9.9% | 10.7% |
| 4 | 6.5% | 8.0% |
| 0 | 12.8% | 7.8% |
| 8 | 5.3% | 7.3% |
| 9 | 5.1% | 6.6% |
| 7 | 3.9% | 6.1% |
⭐ Scalar – digits clicks sequence – clicks vs users
By removing the digits 0 and 3, we get the same order in terms of per clicks and per users perspectives.
| Sequence position | Digits by Clicks | Digit by Users |
| 1 | 2 | 2 |
| 2 | 5 | 5 |
| 3 | 0❓ | 3❓ |
| 4 | 1 | 1 |
| 5 | 3❓ | 6 |
| 6 | 6 | 4 |
| 7 | 4 | 0❓ |
| 8 | 8 | 8 |
| 9 | 9 | 9 |
| 10 | 7 | 7 |
Interesting! All the best! 🙂
? Scalar in action
? Scalar Lite (Free)

? Scalar Pro


It seems to me that the distance of the thumb from the given digit on the keyboard is important here – for example, the digit 7 is the most distant.